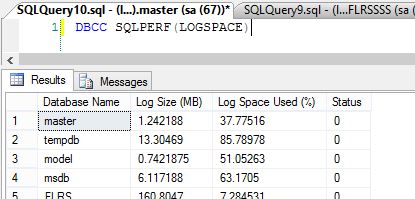
If you want to see the information about log usage you can use the below DBCC command:
DBCC SQLPERF(LOGSPACE)
DBCC SQLPERF(logspace) to get size information about the transaction logs. It help us to monitor the growth of our transaction logs. It will display the log usage along with the log file size of each database.
You can also see the log usage using T-SQL Query:
Use master
GO
SELECT instance_name AS 'Database_Name',
MAX(CASE WHEN counter_name = 'Log File(s) Size (KB)'
GO
SELECT instance_name AS 'Database_Name',
MAX(CASE WHEN counter_name = 'Log File(s) Size (KB)'
THEN cntr_value ELSE 0 END) AS 'Total Log File(s) Size (KB)',
MAX(CASE WHEN counter_name = 'Log File(s) Used Size (KB)'
MAX(CASE WHEN counter_name = 'Log File(s) Used Size (KB)'
THEN cntr_value ELSE 0 END) AS 'Used Size (KB)',
MAX(CASE WHEN counter_name = 'Percent Log Used'
MAX(CASE WHEN counter_name = 'Percent Log Used'
THEN cntr_value ELSE 0 END) AS '% Used'
FROM sysperfinfo
WHERE instance_name != '_total'
AND counter_name IN ( 'Log File(s) Size (KB)', 'Log File(s) Used Size (KB)', 'Percent Log Used' )
GROUP BY instance_name
FROM sysperfinfo
WHERE instance_name != '_total'
AND counter_name IN ( 'Log File(s) Size (KB)', 'Log File(s) Used Size (KB)', 'Percent Log Used' )
GROUP BY instance_name

The one difference in above two methods which I have notice is as follows:
If you will use DBCC SQLPERF then it will not display the database which is in Emergency Mode and also it will not display the Resource database which is the system databases. While using T-SQL query it will display all the database which is in emergency and also the resource database.
Apart from log space info, DBCC SQLPERF command help us to get the below information:
1: Viewing wait statistics data
2: Clearing wait statistics data
3: Clearing latch wait statistics data
2: Clearing wait statistics data
3: Clearing latch wait statistics data
You can use this command as:
1: DBCC SQLPERF(waitstats)
2: DBCC SQLPERF('sys.dm_os_latch_stats' , CLEAR)
3: DBCC SQLPERF('sys.dm_os_wait_stats' , CLEAR)
2: DBCC SQLPERF('sys.dm_os_latch_stats' , CLEAR)
3: DBCC SQLPERF('sys.dm_os_wait_stats' , CLEAR)
Please do not clear the wait stats data on production environment as it help us during troubleshooting of performance related issues.
Thanks For reading this Blog!!!
No comments:
Post a Comment